 Home
 Today's Top Picks
 Top Performers
 Watchlist
 My Robo Portfolios
 ETF Zone
 How It Works
 Learning Center
 News
How Upturn Works
Upturn is currently an advisory-only financial intelligence platform.
You cannot execute trades on Upturn.
Independent & SEC-Registered. We advise - you decide.
AI-Powered Financial Intelligence Platform
Upturn combines AI-driven market intelligence, historical simulations, explainability systems, and large-scale financial data processing to help retail investors better analyze stocks, ETFs, and portfolio behavior over time.
Upturn generates automated daily BUY, SELL, and PASS advisories after market close using proprietary quantitative, statistical, machine-learning, and rules-based methods across approximately 9,500 eligible U.S.-listed stocks and ETFs.
While individual advisories remain consistent across users, investors can personalize their experience using filters such as market capitalization, security type, stock price range, advisory status, and Upturn Scorecard metrics, while also creating custom watchlists.
Build hypothetical Robo-Portfolios from the filters or holdings you select. Your selections customize the portfolio shown; Upturn does not assess your complete financial circumstances or determine whether the portfolio is suitable for you.
The platform continuously updates advisories, analytics, simulations, and market intelligence using large-scale financial data and historical analysis frameworks.
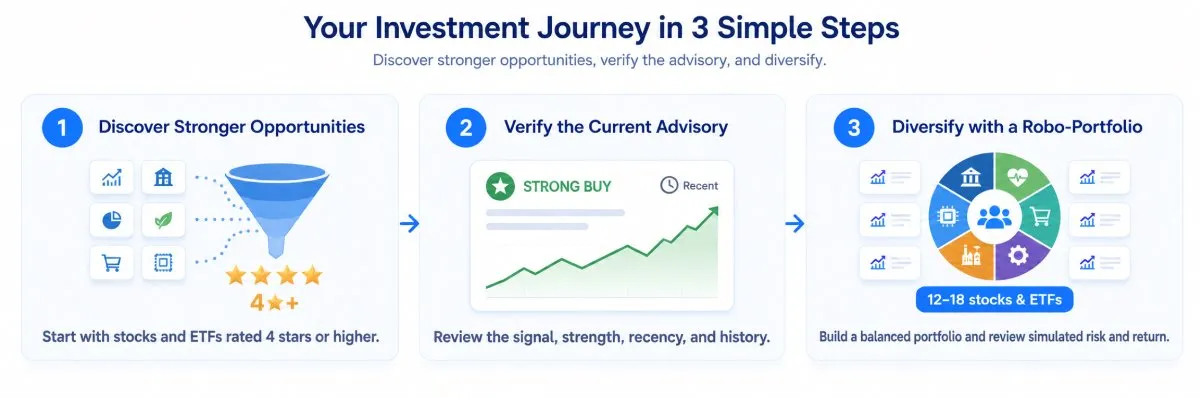
Your Investment Journey in 3 Simple Steps
Simplify your investment decision-making with greater clarity and confidence using the following approach:
Filter by Upturn Star Rating
Start with stocks and ETFs rated 4★ or higher based on Upturn’s AI-driven analysis of performance, trends, and market conditions. This helps filter for companies with stronger fundamentals, historical performance, and overall market strength.
Follow Recent Strong Buy Advisories
Focus on stocks with recent “Strong Buy” advisories to identify potential upward momentum and recent signals indicating potential upward momentum under Upturn’s model.
Diversify Your Portfolio
Build a balanced portfolio of 12–18 stocks and ETFs across sectors, ratings, and market capitalizations to help manage risk and explore portfolio concentration and historical simulated risk measures.
Core Financial Intelligence Platform
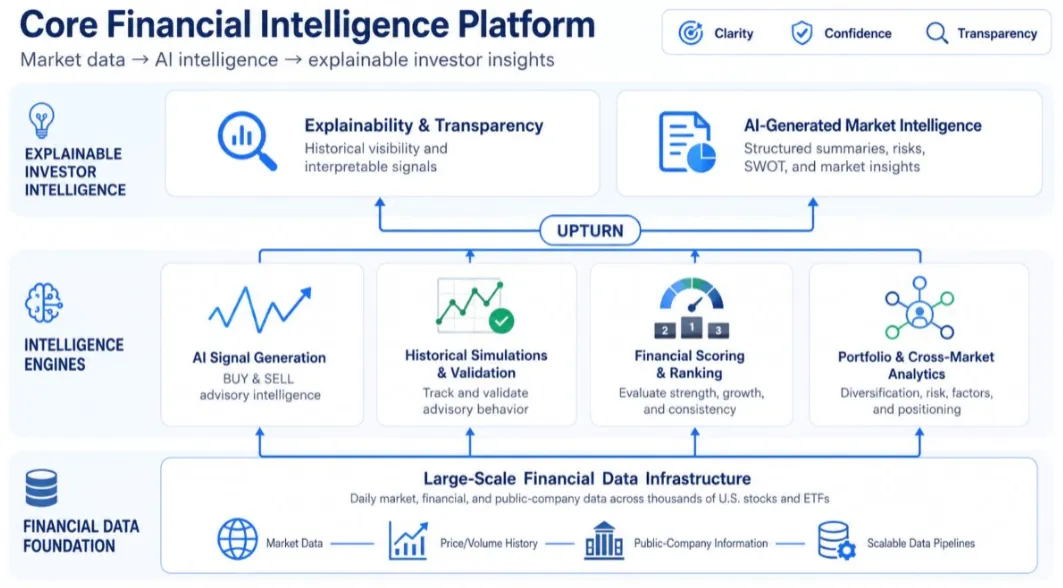
Upturn’s financial intelligence platform combines large-scale market data processing, AI-driven advisory systems, historical simulations, and explainability frameworks to help investors better analyze market behavior, portfolio dynamics, and long-term investment trends.
The platform includes:
Automated Signal Generation Systems
The core advisory engine behind Upturn BUY, SELL, and PASS advisories. These quantitative systems analyze end-of-day (market close) stock price and volume data using proprietary quantitative, statistical, machine-learning, and rules-based methods to generate advisory signals. Separate AI-assisted features support search and research summaries; generative AI does not generate or alter Upturn's proprietary advisory outputs.
Historical Simulations & Validation Frameworks
Simulation infrastructure designed to track, analyze, and validate historical BUY and SELL advisory behavior across changing market conditions over time.
Financial Scoring & Ranking Engines
Multi-dimensional scoring systems that evaluate securities using financial strength, growth trends, market behavior, portfolio intelligence, and advisory consistency.
Portfolio Intelligence & Cross-Market Analytics
Analytics systems that evaluate portfolio composition, diversification, risk behavior, factor exposure, and broader market positioning across sectors and asset categories.
Explainability & Transparency Systems
Transparency-first frameworks designed to provide historical visibility into advisory behavior, interpretable signal analysis, and explainable investment intelligence.
AI-Generated Market Intelligence
AI-assisted systems that generate structured summaries, market insights, SWOT-style analysis, and broader financial intelligence across companies, sectors, and market trends.
Large-Scale Financial Data Infrastructure
Scalable data processing systems that continuously ingest, analyze, and update financial, market, and public company data across thousands of U.S. stocks and ETFs daily.
What Upturn Provides
- Daily updated automated BUY and SELL advisories for approximately 9,500 eligible U.S.-listed stocks and ETFs (subject to data availability and eligibility requirements)
- Daily Top Picks and curated market intelligence lists including Top Performers, momentum leaders, and securities meeting Upturn’s screening criteria
- Upturn Star Ratings based on historical advisory performance
- Upturn Scorecards built using publicly available financial data and SEC filings
- Revenue analysis across products, geographies, and year-over-year growth trends
- Company summaries and AI-assisted SWOT-style intelligence
- Hypothetical Robo-Portfolios customized from user-selected filters, criteria, or holdings
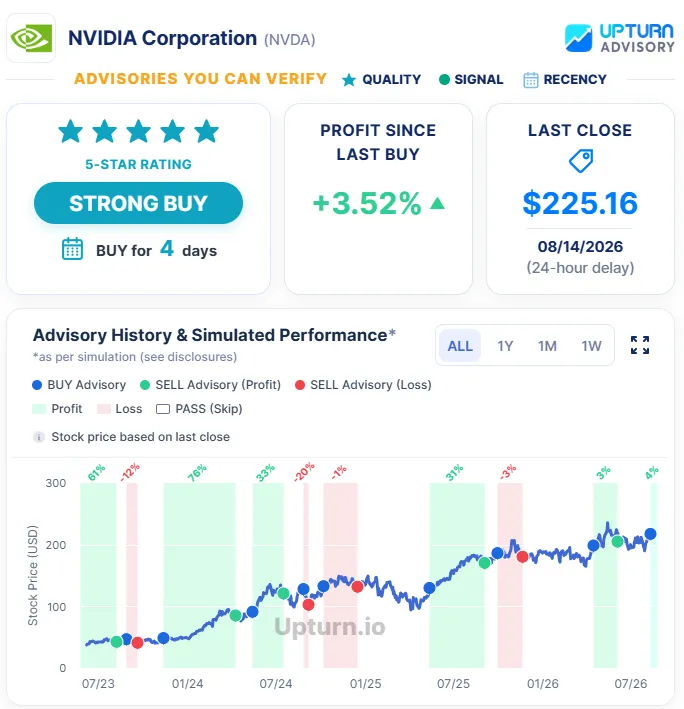
- Historical visibility into past BUY and SELL advisories
- Interactive charts and analytics for valuation, trend, and risk analysis
- Daily refreshed market intelligence using evolving financial and market data
- Market intelligence summaries across global news, U.S. markets, sectors, and leading companies designed to filter noise and evaluate directional market impact
- Upturn Gauge market intelligence indicators powered by Upturn Analytics
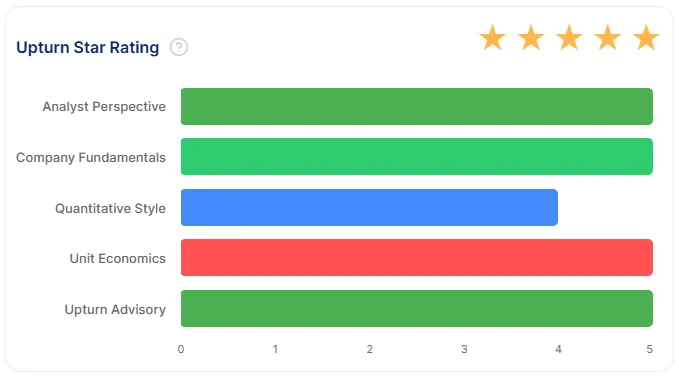
Upturn Financial Intelligence Layers
Upturn Star Rating
Upturn Star Ratings summarize historical advisory success, simulated investment performance, trading volume, Price Path, and Price Stability. For individual stocks, weak company fundamentals may reduce the rating. Company fundamentals are not applied to ETFs.
Ratings range from one to five stars and do not guarantee future results.
Key Evaluation Factors:
- Historical Advisory Success & Simulated Performance — evaluating completed advisory cycles and historical consistency
- Trading Volume & Liquidity — ensuring sufficient market activity and investability
- Price Path & Price Stability — assessing trajectory direction and price movement smoothness
- Fundamentals Deduction (Stocks Only) — weak balance sheet strength, liquidity, or financial health reduces the rating
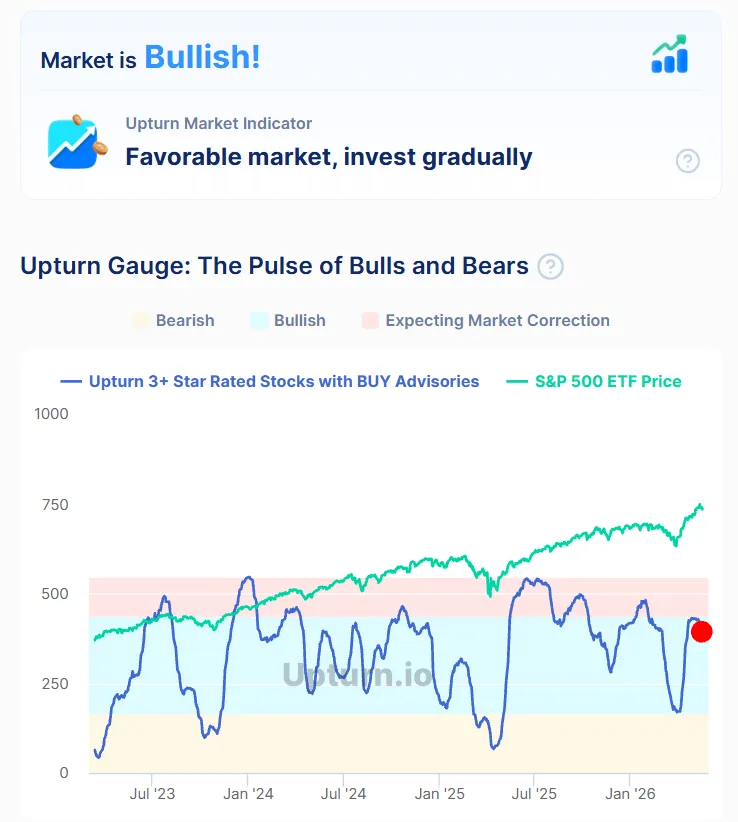
Upturn Gauge
The Upturn Gauge provides a consolidated view of market trends, advisory direction, and underlying financial quality indicators.
By analyzing the distribution of BUY and SELL advisories across large-cap and mid-cap stocks rated Upturn 3-Star or higher, the platform helps identify broader market conditions, including bullish trends, bearish conditions, and potential market corrections.
Upturn Gauge provides a simplified view of broader market positioning and investment quality.
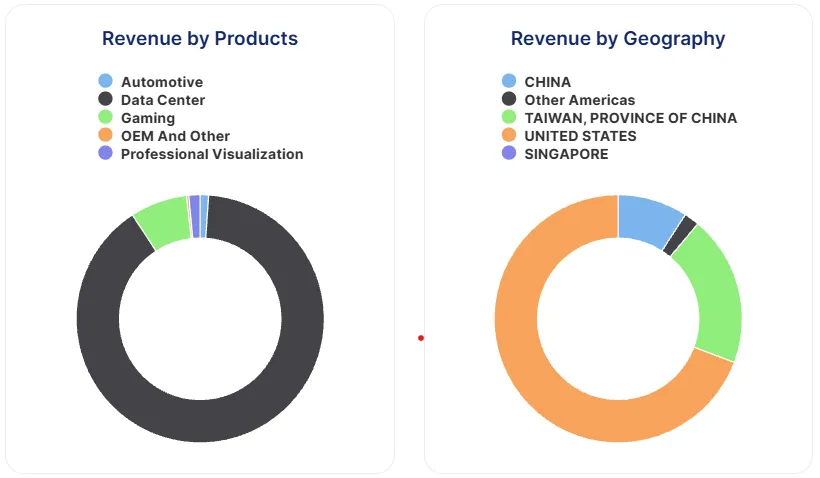
Revenue by Products and Geography
Revenue breakdowns by product segments and geographic regions, along with year-over-year growth trends, are provided for stocks where underlying company disclosures and financial data are available.
This helps investors better understand business diversification, growth drivers, and regional revenue concentration.
Upturn Scorecard
The Upturn Scorecard is a multi-dimensional financial intelligence framework designed to evaluate stocks across business quality, financial strength, market behavior, and AI-driven analysis systems.
The Scorecard includes:
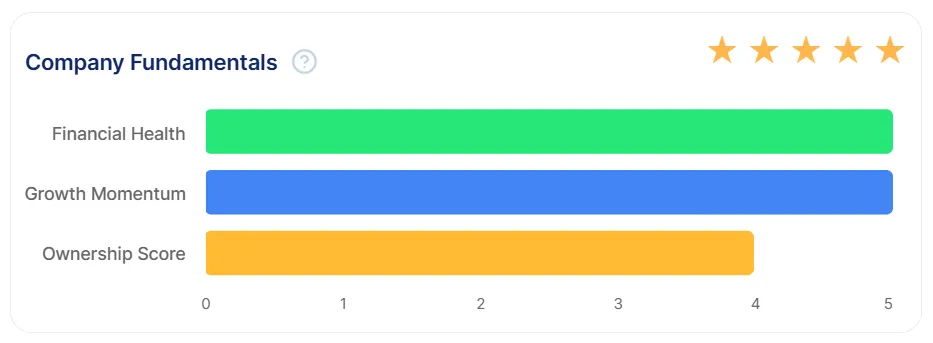
Company Fundamentals
Measures core business quality and is a composite score combining financial health, growth momentum, and ownership structure into a unified view of business quality. Reflects durability, scalability, and efficiency.
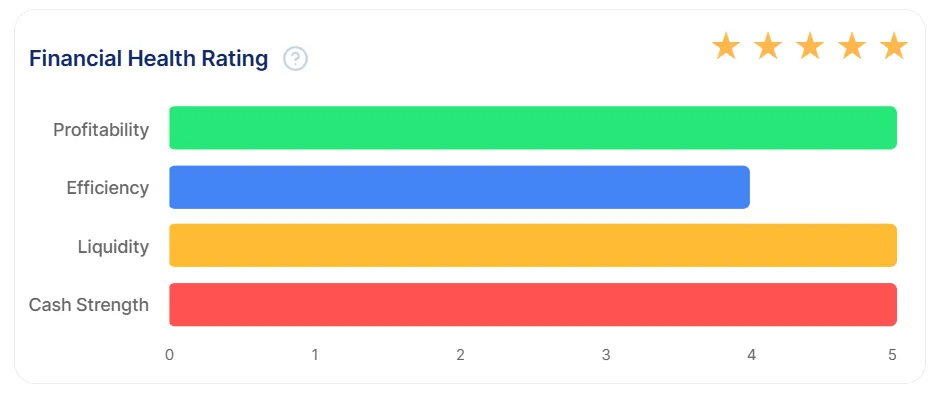
Financial Health
Evaluates balance sheet strength, profitability, cash flow stability, debt levels, liquidity, and overall financial resilience. Indicates resilience under stress.
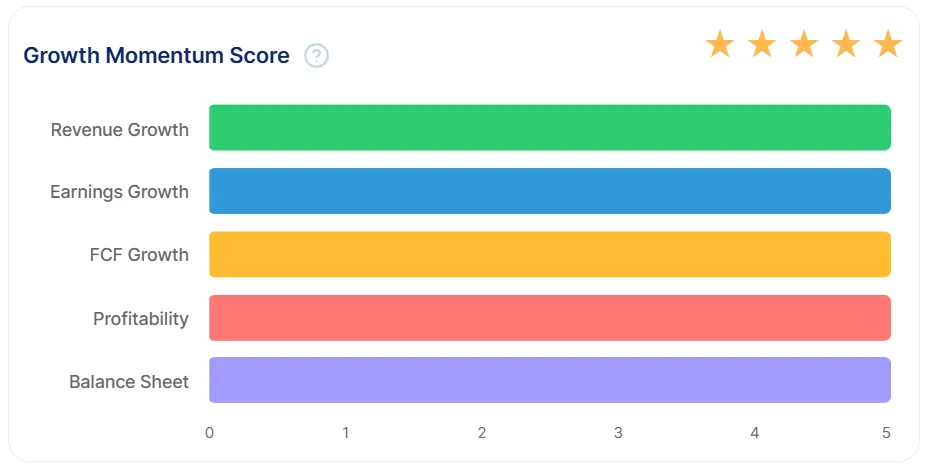
Growth Metrics
Analyzes historical and projected growth trends across revenue, earnings, cash flow, and operational expansion. Captures consistency and strength of business growth. Indicates expansion potential.
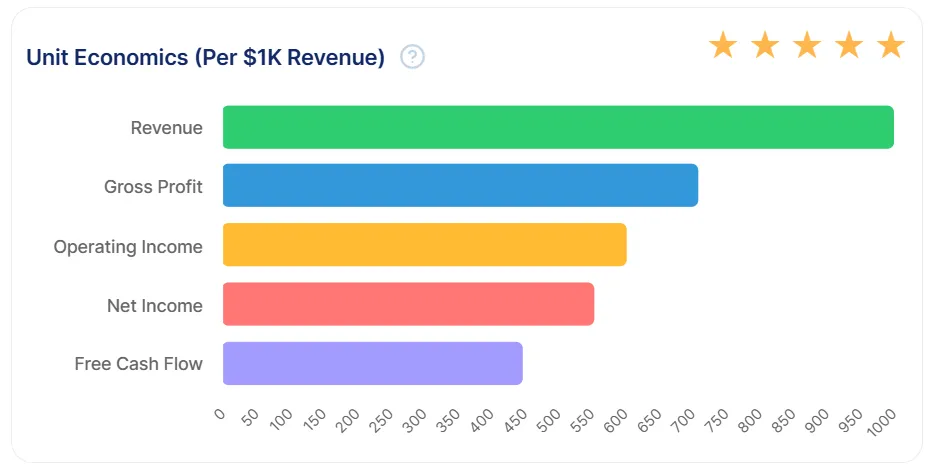
Unit Economics
Assesses business efficiency and economic sustainability through margins, operating income, net income, and free cash flow metrics measured relative to revenue, helping evaluate profitability quality, operational efficiency, and earnings sustainability.
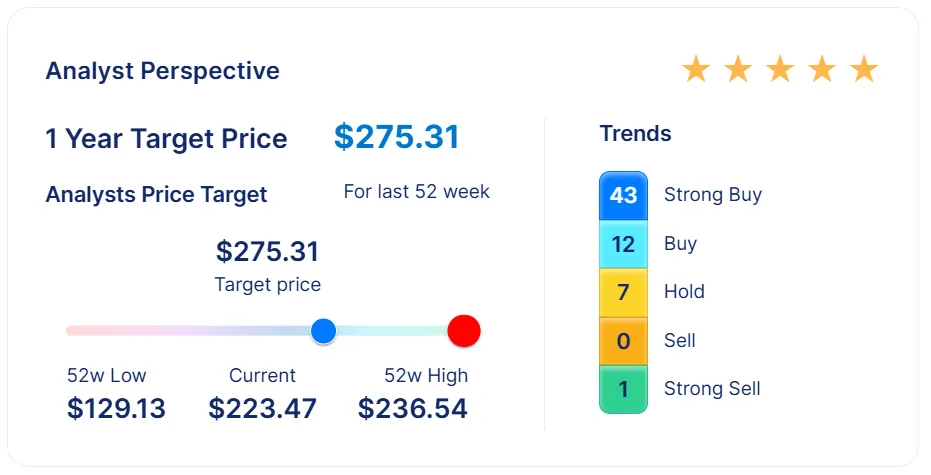
Analyst & Market Perspective
Incorporates analyst sentiment, analyst coverage levels, BUY/SELL/HOLD rating distributions, ratings trends, target price analysis, and broader market positioning signals to evaluate market perception and investor sentiment.
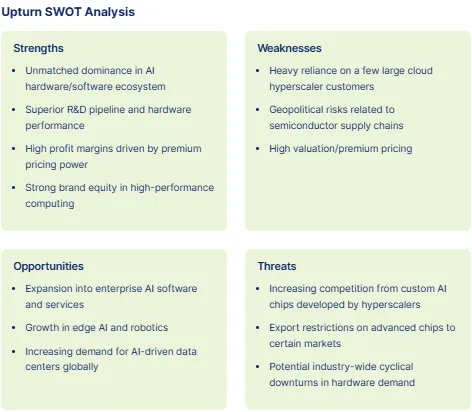
AI SWOT Analysis
Uses AI-generated structured analysis to identify company strengths, weaknesses, opportunities, and risks using financial, operational, and market intelligence data.
Historical Advisory Performance
Tracks the historical behavior and performance consistency of prior BUY and SELL advisories across changing market conditions over time.
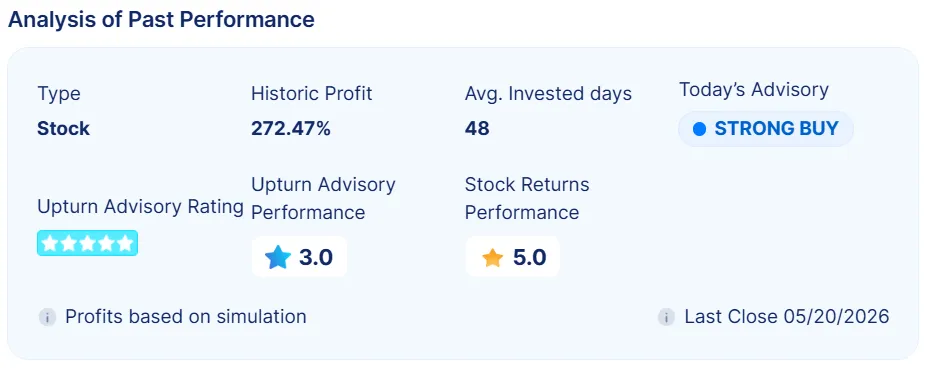
Historical Simulations & Advisory Intelligence
Upturn continuously tracks and analyzes prior BUY and SELL advisories across changing market conditions to help investors better evaluate long-term signal consistency and portfolio behavior over time.
The platform maintains transparent historical visibility into prior advisories, allowing investors to evaluate recommendation timing, historical signal consistency, and long-term performance context.
Upturn Robo Portfolios
Upturn Robo Portfolios combine AI-driven advisory systems, portfolio intelligence, market analytics, and financial scoring frameworks to help investors discover diversified portfolio strategies aligned with specific investment objectives and market conditions.
The portfolios continuously incorporate:
AI-generated BUY and SELL advisories for portfolio holdings
Risk and trend analysis using portfolio metrics such as Sharpe Ratio and volatility analysis
Historical advisory intelligence with portfolio-level simulations and analytics
Cross-market analytics and financial intelligence scoring systems
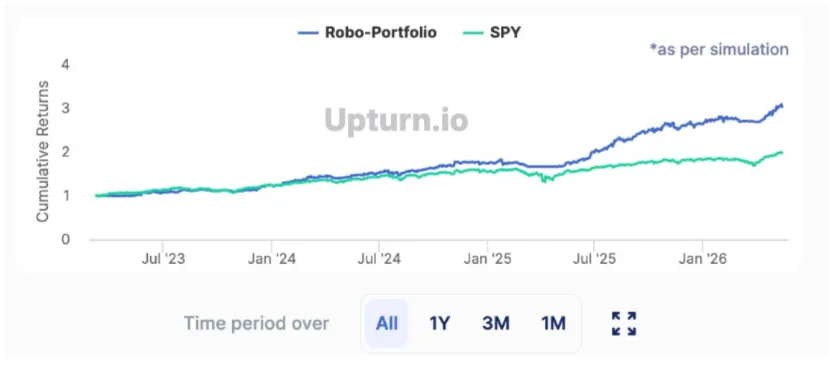
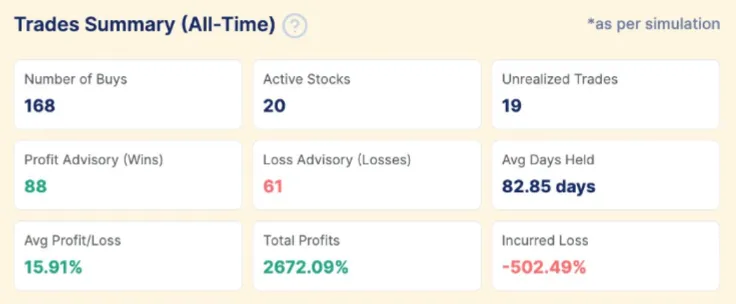
Portfolio Simulations
Portfolio simulations allocate equal weight to portfolio holdings and calculate historical portfolio performance over approximately the past 2.5 years using historical BUY and SELL advisories.
These simulations help investors evaluate historical portfolio behavior, advisory consistency, simulated returns, and long-term portfolio positioning. Please review disclosures regarding assumptions and hypothetical return calculations.
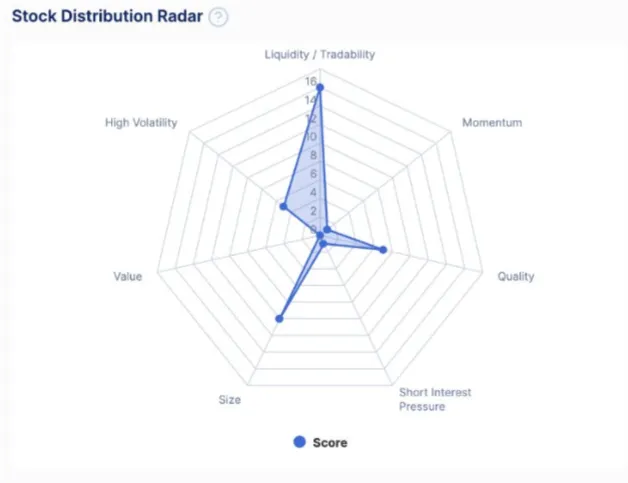
Stock Distribution Radar
The Stock Distribution Radar provides a simulation-based visualization of portfolio positioning across investment factors such as liquidity, momentum, quality, value, size, volatility, and short-interest pressure.
The chart helps investors understand portfolio balance, concentration, and factor exposure across multiple investment dimensions.
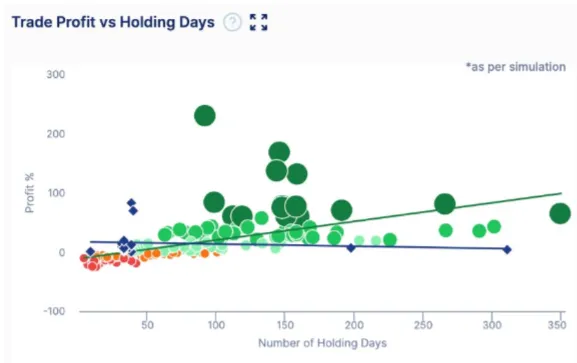
Trade Profit vs Holding Days Analysis
This chart visualizes the relationship between holding duration and advisory profitability across all stocks and ETFs within the Robo Portfolio.
Each point represents an individual advisory, helping investors evaluate historical advisory consistency, profitability distribution, and holding-period behavior based on simulation data.
The analysis can help investors assess historic Upturn advisory performance across the stocks, visualize average simulated profits, average holding periods and trends and better understand the long-term behavior of Upturn advisories across different market conditions.
Explainability & Transparency
Upturn is designed around transparency-first financial intelligence principles focused on explainability, historical accountability, and long-term investor trust.
The platform emphasizes:
- Explainable advisory systems
- Historical signal visibility
- Transparent analytical frameworks
- Portfolio-level intelligence
- Long-term validation and accountability
rather than isolated prediction-based investing.
Platform Philosophy
Upturn believes financial intelligence systems should prioritize transparency, explainability, historical accountability, and long-term investor trust over short-term engagement and prediction-driven narratives.
Why Upturn
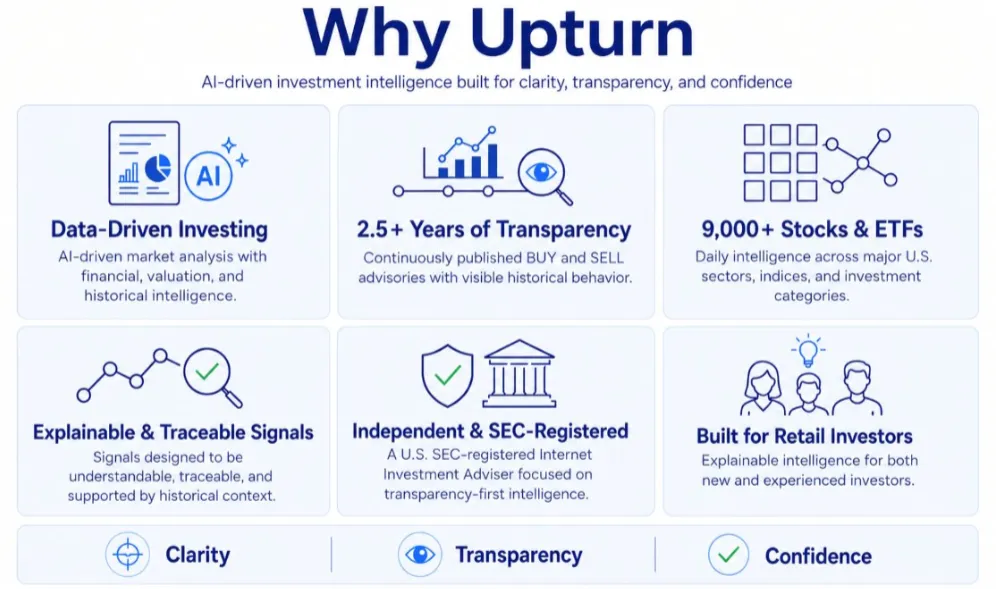
Data-Driven Investing
Every BUY and SELL advisory is augmented by AI-driven market analysis with financial, valuation, and historical intelligence systems.
Historical Transparency
Explore the historical advisories and simulated outcomes available for each covered security.
Large-Scale Market Coverage
Upturn covers approximately 9,500 U.S.-listed stocks and ETFs, subject to data availability and eligibility requirements. Coverage is not exhaustive and may change.
Daily Intelligence Refresh
Signals, ratings, analytics, and financial intelligence systems are continuously refreshed using evolving market and financial data.
Independent & SEC-Registered
Upturn is a U.S. SEC-registered Internet Investment Adviser providing model-generated advisories, with potential conflicts described in our Disclosures.
Built for Retail Investors
Upturn is designed to help both new and experienced investors gain greater clarity, transparency, and confidence in investment decision-making through advisory history and methodology information.

Note: This website is maintained by Upturn Corporation, which is an investment adviser registered with the U.S. Securities and Exchange Commission. Such registration does not imply a certain level of skill or training. Investing in securities has risks. Past performance is no guarantee of future returns. No assurance is provided as to any particular investment return, and you may lose money using our services. You are strongly advised to consult appropriate counsel before making any investments in companies you learn about through our services. You should obtain appropriate legal, tax, investment, accounting, and other advice that takes into account your investment portfolio and overall financial situation. You are solely responsible for conducting due diligence on a potential investment. We do not affect trades for you. You will select your own broker through which to transact. Investments are not FDIC insured, they are not guaranteed, and they may lose value. Please see the Privacy Policy, Terms of Use, and Disclosure for more information.
All company names, trademarks, logos, and brands are the property of their respective owners and are used for identification and informational purposes only. Use of these names, trademarks, and logos does not imply endorsement by their respective owners.